Community Connection
Community campaigns and events · Founder, UX and Systems Designer · 2024–2027
Role
Founder, UX & Systems Designer
Org type
Community campaigns
Timeline
2024–2027
Methods
XR campaign, belonging measurement
Outcome
4 sponsorship tiers; $17.5K pilot target
The problem
Community Connection is built on one idea: belonging can be designed. The Self Acceptance XR Campaign turns employee belonging into something people do rather than something they are surveyed about. The Community Connection Events pilot brings neighbors of different generations together at their own community center, and raises funds to pre-purchase tickets that community members spend with local entrepreneurs.
Four connected projects
Two build belonging, inside organizations and between neighbors. Two organize whole sectors, among donors and among nonprofits. Select a project to open the details, key metrics, and technical appendix.
1. Self Acceptance XR Campaign4 sponsorship tiers · 2 measurement tracks replacing the survey
Diagnosis
Companies pursuing DEIB initiatives lacked a way to make community engagement and employee belonging both measurable and genuinely engaging. Most sponsorship-driven DEIB activations leaned on generic events or post-event surveys, and surveys don't capture how people actually move through a challenge.
Intervention
Designed an on-location extended-reality campaign in which employees complete self-acceptance-themed XR quests, sponsored and competed on internally by participating companies. Built a four-tier sponsorship structure ($5,000 to $50,000+) and a full logic-model impact framework (inputs, outputs, and short, medium, and long-term outcomes) tracking two parallel metric sets: employee engagement (participation, referrals, team collaboration, trust) and public perception (community support, brand welcome-ness). The quest replaces the survey entirely with something people opt into by doing it.
Technical appendix
Research and Methodology
Built as an inputs, outputs, and impact logic model rather than a single-event plan, explicitly designed to gather both quantitative and qualitative signal through participant quests instead of surveys.
Scoring and Logic
Engagement is measured through participation counts, referral counts, and team collaboration. Public perception is measured through community-support and brand-welcome indicators.
Constraints and Assumptions
The campaign was at the concept and sponsorship-seeking stage as of its January 2024 source material and had not yet run at scale.
Obstacles Encountered
Quantifying inherently qualitative human experiences (belonging, trust, self-acceptance) without defaulting back to the surveys the campaign was built to replace.
2. Community Connection EventsPilot in design · $17,500 fundraising target · about 100 attendees
Diagnosis
The event is built around two gaps. Young adults and elders who live in the same neighborhood rarely meet, and the resources already inside the local community center, such as a mini computer lab, active community groups, and supportive services, need a way to be seen. The aim is reconnection among neighbors, community pride, and violence prevention.
Intervention
Designed a Community Connection Event pilot: a four-to-five-hour event at a neighborhood community center, promoted by volunteers flyering door to door two weeks ahead. The fundraising mechanism is tickets. Funds pre-purchase tickets for local entrepreneurs (a mobile market, food trucks, and a barbershop), and the tickets are given to community members to spend. They keep community members' dignity intact, teach basic economics through experience, and support local businesses, and barter and trade activities are being explored to teach other forms of capital. Bonding is built into the activities: a Skills Challenge Day where individuals earn badges for their own unique skills (such as meeting three new people or learning a recipe from an elder), a Team Relay Tournament where mixed-age teams rotate through stations, and a Partner Swap Tournament where players change partners each round, alongside non-athletic options such as art projects rooted in self-pride, a hair braiding class, and a neighborhood pride message board. Health-insurance connectors, trauma-informed community mental health workers, and naturopaths are being considered as name-tagged participants woven among the volunteers, not as vendors, to normalize community support. If the pilot goes well, similar events would follow at other community centers in areas at risk for violence, with an original goal of five centers in one summer.
Technical appendix
Research and Methodology
This is a pilot in design, not yet run. The plan is built from an activity mix, a vendor and ticket model, and a per-attendee cost build-up, to be tested at one site before any replication.
Scoring and Logic
The fundraising target is built from about $175 per attendee: $35 for a haircut, $15 for a food plate, $25 for arts and crafts, and $100 in overhead. At 100 attendees, that comes to $17,500.
Constraints and Assumptions
No date is set. Thanksgiving, Spring Break, and later in summer 2027 are all under consideration, and the choice depends on community organizations and their support. Attendance of 100 is a target, and the embedded health and mental health participants are still being considered.
Obstacles Encountered
The open questions at this stage are timing and partner support, how to incorporate barter and trade so attendees learn about other forms of capital, and how to embed health and mental health participants so they feel part of the event rather than a booth.
3. Philanthropic Organizing CircleOutlook built · Louisville and Anchorage · donor briefing in outreach
Diagnosis
Three pressures land on nonprofits in the same five years: need is rising, the donors and leaders who fund and run the sector are aging out, and fewer workers stand behind each retiree to carry the tax base. Half of nonprofit leaders expect to leave within five years, only one in three organizations has a succession plan, and the average donor is 64. Major donors still tend to give one organization at a time, so commitments arrive after the need instead of before it.
Intervention
Built a Five-Year Sector Outlook (2026 to 2031) for Louisville, with Anchorage as a comparison, and packaged it as a printed brief with five exhibits, an on-screen deck, a donor-facing blog and a seven-post LinkedIn rollout. The outlook is the briefing a donor group receives before organizing its commitments around three areas: future initiatives, succession, and the requirements organizations will need to meet. Rather than building a competing group, the first briefing is offered inside an existing room, starting with the Community Foundation of Louisville as a donor education session.
Technical appendix
Research and Methodology
Combined federal and state data (Giving USA, BLS, Social Security Trustees, Census, Federal Reserve, FBI, CDC, HHS, HUD and others) back to 1975 where available, converted counts to per-person rates, and compared Louisville with Anchorage. Leader seats opening locally were estimated from each metro's management jobs (BLS, May 2023) times the 2.1% to 3.4% of managers who leave the workforce each year.
Scoring and Logic
A tax-per-seat model prices what one job pays into public systems each year: a $122,090 leader seat generates about $40,871 in Kentucky and $36,715 in Alaska, 4.4 to 4.6 times an entry-level care job. Alaska has no state income tax and shows the same gap, so the problem is workforce and succession, not state tax policy. The donor group's success is measured by commitments organized per theme and how many organizations they reach, not attendance.
Constraints and Assumptions
Outlook complete; donor group not yet convened. Seat counts and tax figures are labeled estimates, not published data. Child abuse figures count reports filed, not confirmed cases, and leader exit surveys measure intent, which has historically run ahead of actual turnover.
Obstacles Encountered
Access. Major donor groups are often invitation-only, so earning a seat to present requires an introduction from a member, a community foundation or a funder association. A national count of nonprofit executive directors was not found in the sources searched, so local seat estimates rely on federal manager categories.
4. Nonprofit Speed Dating Design SprintConcept · 3-hour sector sprint · assessment-matched partners
Diagnosis
Nonprofits serving the same population, such as people leaving incarceration, often work side by side without working together. Partnerships form by proximity rather than fit, and when collaboration, shared management or a merger is on the table, there are no agreed guardrails for ownership and decision-making.
Intervention
A three-hour design sprint for one sector. Hour one: each organization completes an Organization Evaluation that identifies its strengths and its secret sauce, followed by introductions and a short presentation on purpose, intention and desired outcomes. Next, organizations are matched by opposite but complementary strengths and rotate tables every five minutes, speed-dating style, to meet collaboration prospects. Then affinity mapping: each participant writes three problems, risks or issues, one per sticky note, and places them in sector categories such as economy, social, basic needs and volunteers. The facilitator sorts the notes into patterns in 5 to 10 minutes and selects the top two or three per category. Each pattern goes to a small group, which must design a solution using only the resources, constraints and institutional knowledge already in the room. The final 30 minutes are group presentations, framed as action steps organizations can take.
Technical appendix
Research and Methodology
Built on the Organization Evaluation, a tool developed for evaluating strategic partnerships from the outside. Each organization rates 13 categories against a "Perfect 6", recording where it is now, why, and its ideal score: management systems, culture, team connection, leadership balance, team building, future building, network relationships, viral traction, financial health, free contribution, products, investments and cost per acquisition. The tool also captures organization purpose, top three values and priorities, success measures, and an action plan for the lowest category at one week, one month and three to six months. Affinity mapping and a time-boxed design sprint follow. Reentry is the first sector planned; the format is designed to repeat for any sector.
Scoring and Logic
Organizations are paired when one scores high where the other scores low, so each match covers a real gap: for example, strong network relationships with strong management systems. Affinity categories are set per sector (for example physical, community, cultural and social, or economy, social, basic needs and volunteers), and the top two or three patterns in each category become the sprint challenges. Each organization leaves with its lowest category tied to a one-week, one-month and three-to-six-month action plan.
Constraints and Assumptions
Concept stage; not yet run. Every solution must use resources participants already have, which reinforces resourcefulness and cross-pollination. The sprint is also intended to set guardrails and best practices for ownership, management and future collaboration.
Obstacles Encountered
Securing three hours from executive leaders, building enough trust for organizations to name real weaknesses on an assessment, and turning one-day matches into lasting agreements.
Project visuals

Self Acceptance XR Campaign
Most belonging programs measure how people feel through a survey. This campaign turns belonging into something employees do, produces data an organization can act on, and is funded through four sponsorship tiers.
Click the image to enlarge
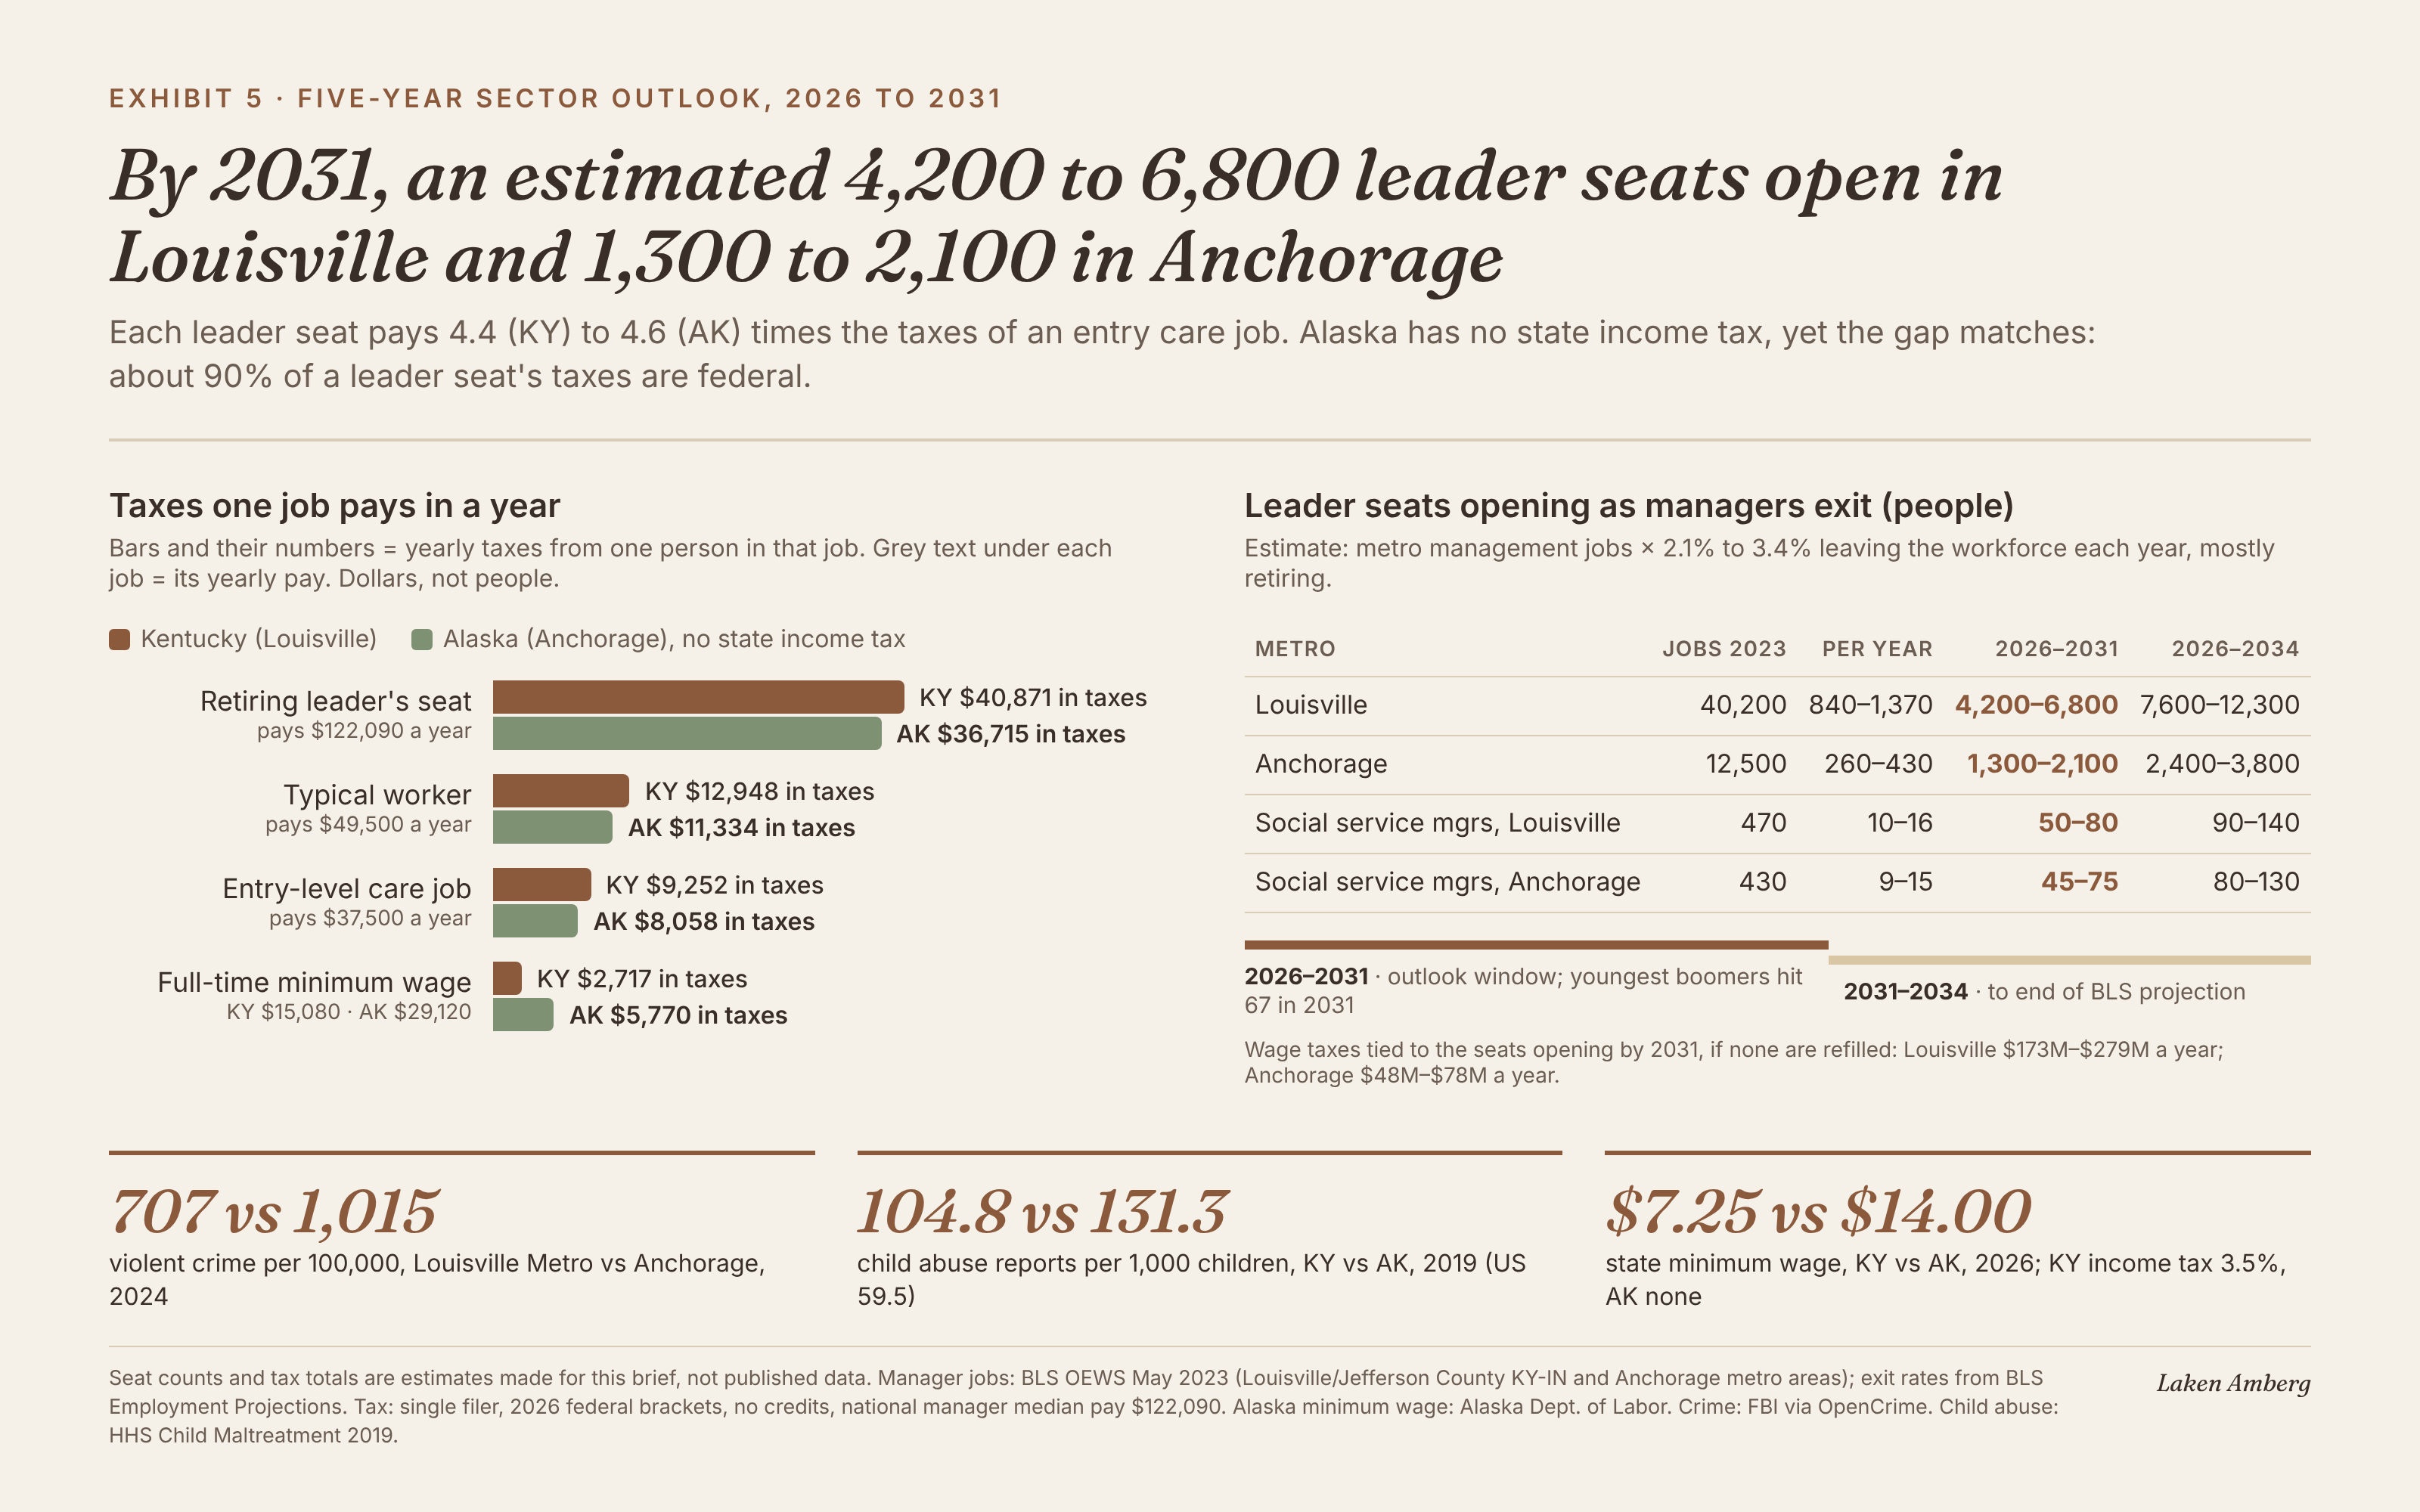
Five-Year Sector Outlook: two cities
Louisville and Anchorage have different tax systems and the same leadership gap. By 2031, an estimated 4,200 to 6,800 leader seats open in Louisville and 1,300 to 2,100 in Anchorage, and each one pays 4.4 to 4.6 times the taxes of an entry care job.
Click the image to enlarge
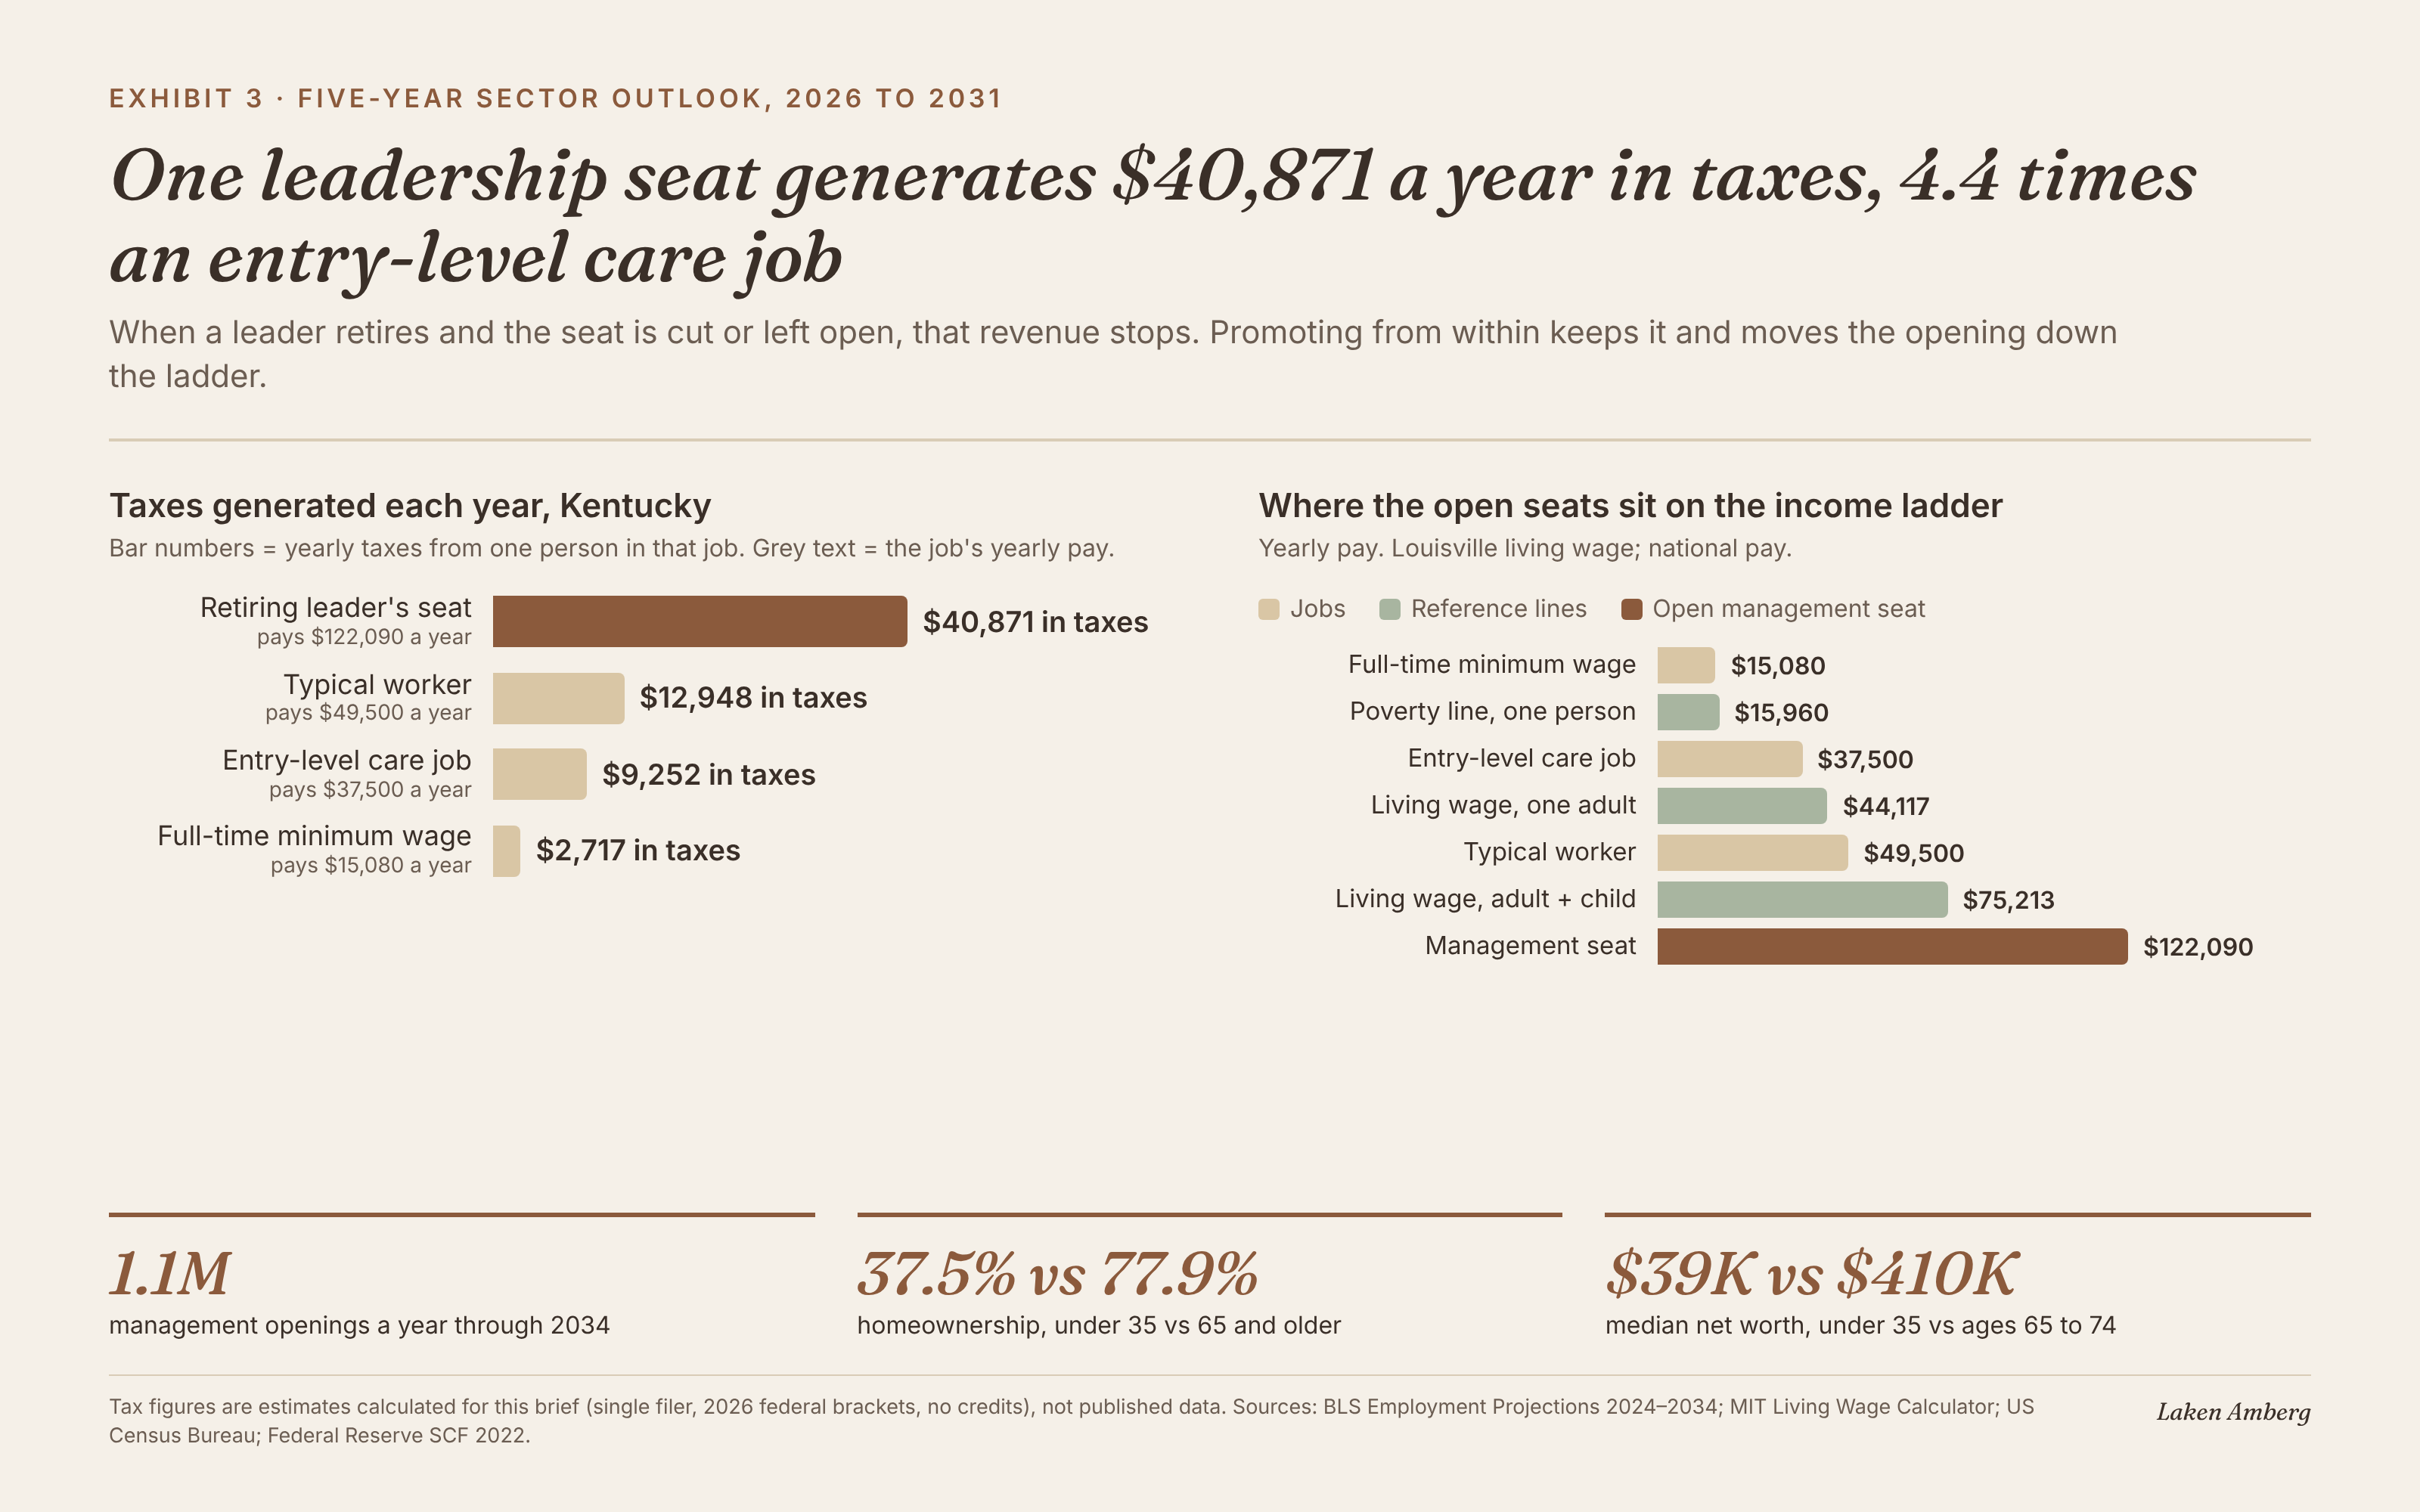
Five-Year Sector Outlook: one seat, four paychecks
A tax-per-seat model shows what one job pays into public systems each year. When a retiring leader's seat is cut or left open, about $40,871 a year stops; promoting from within keeps it.
Click the image to enlarge
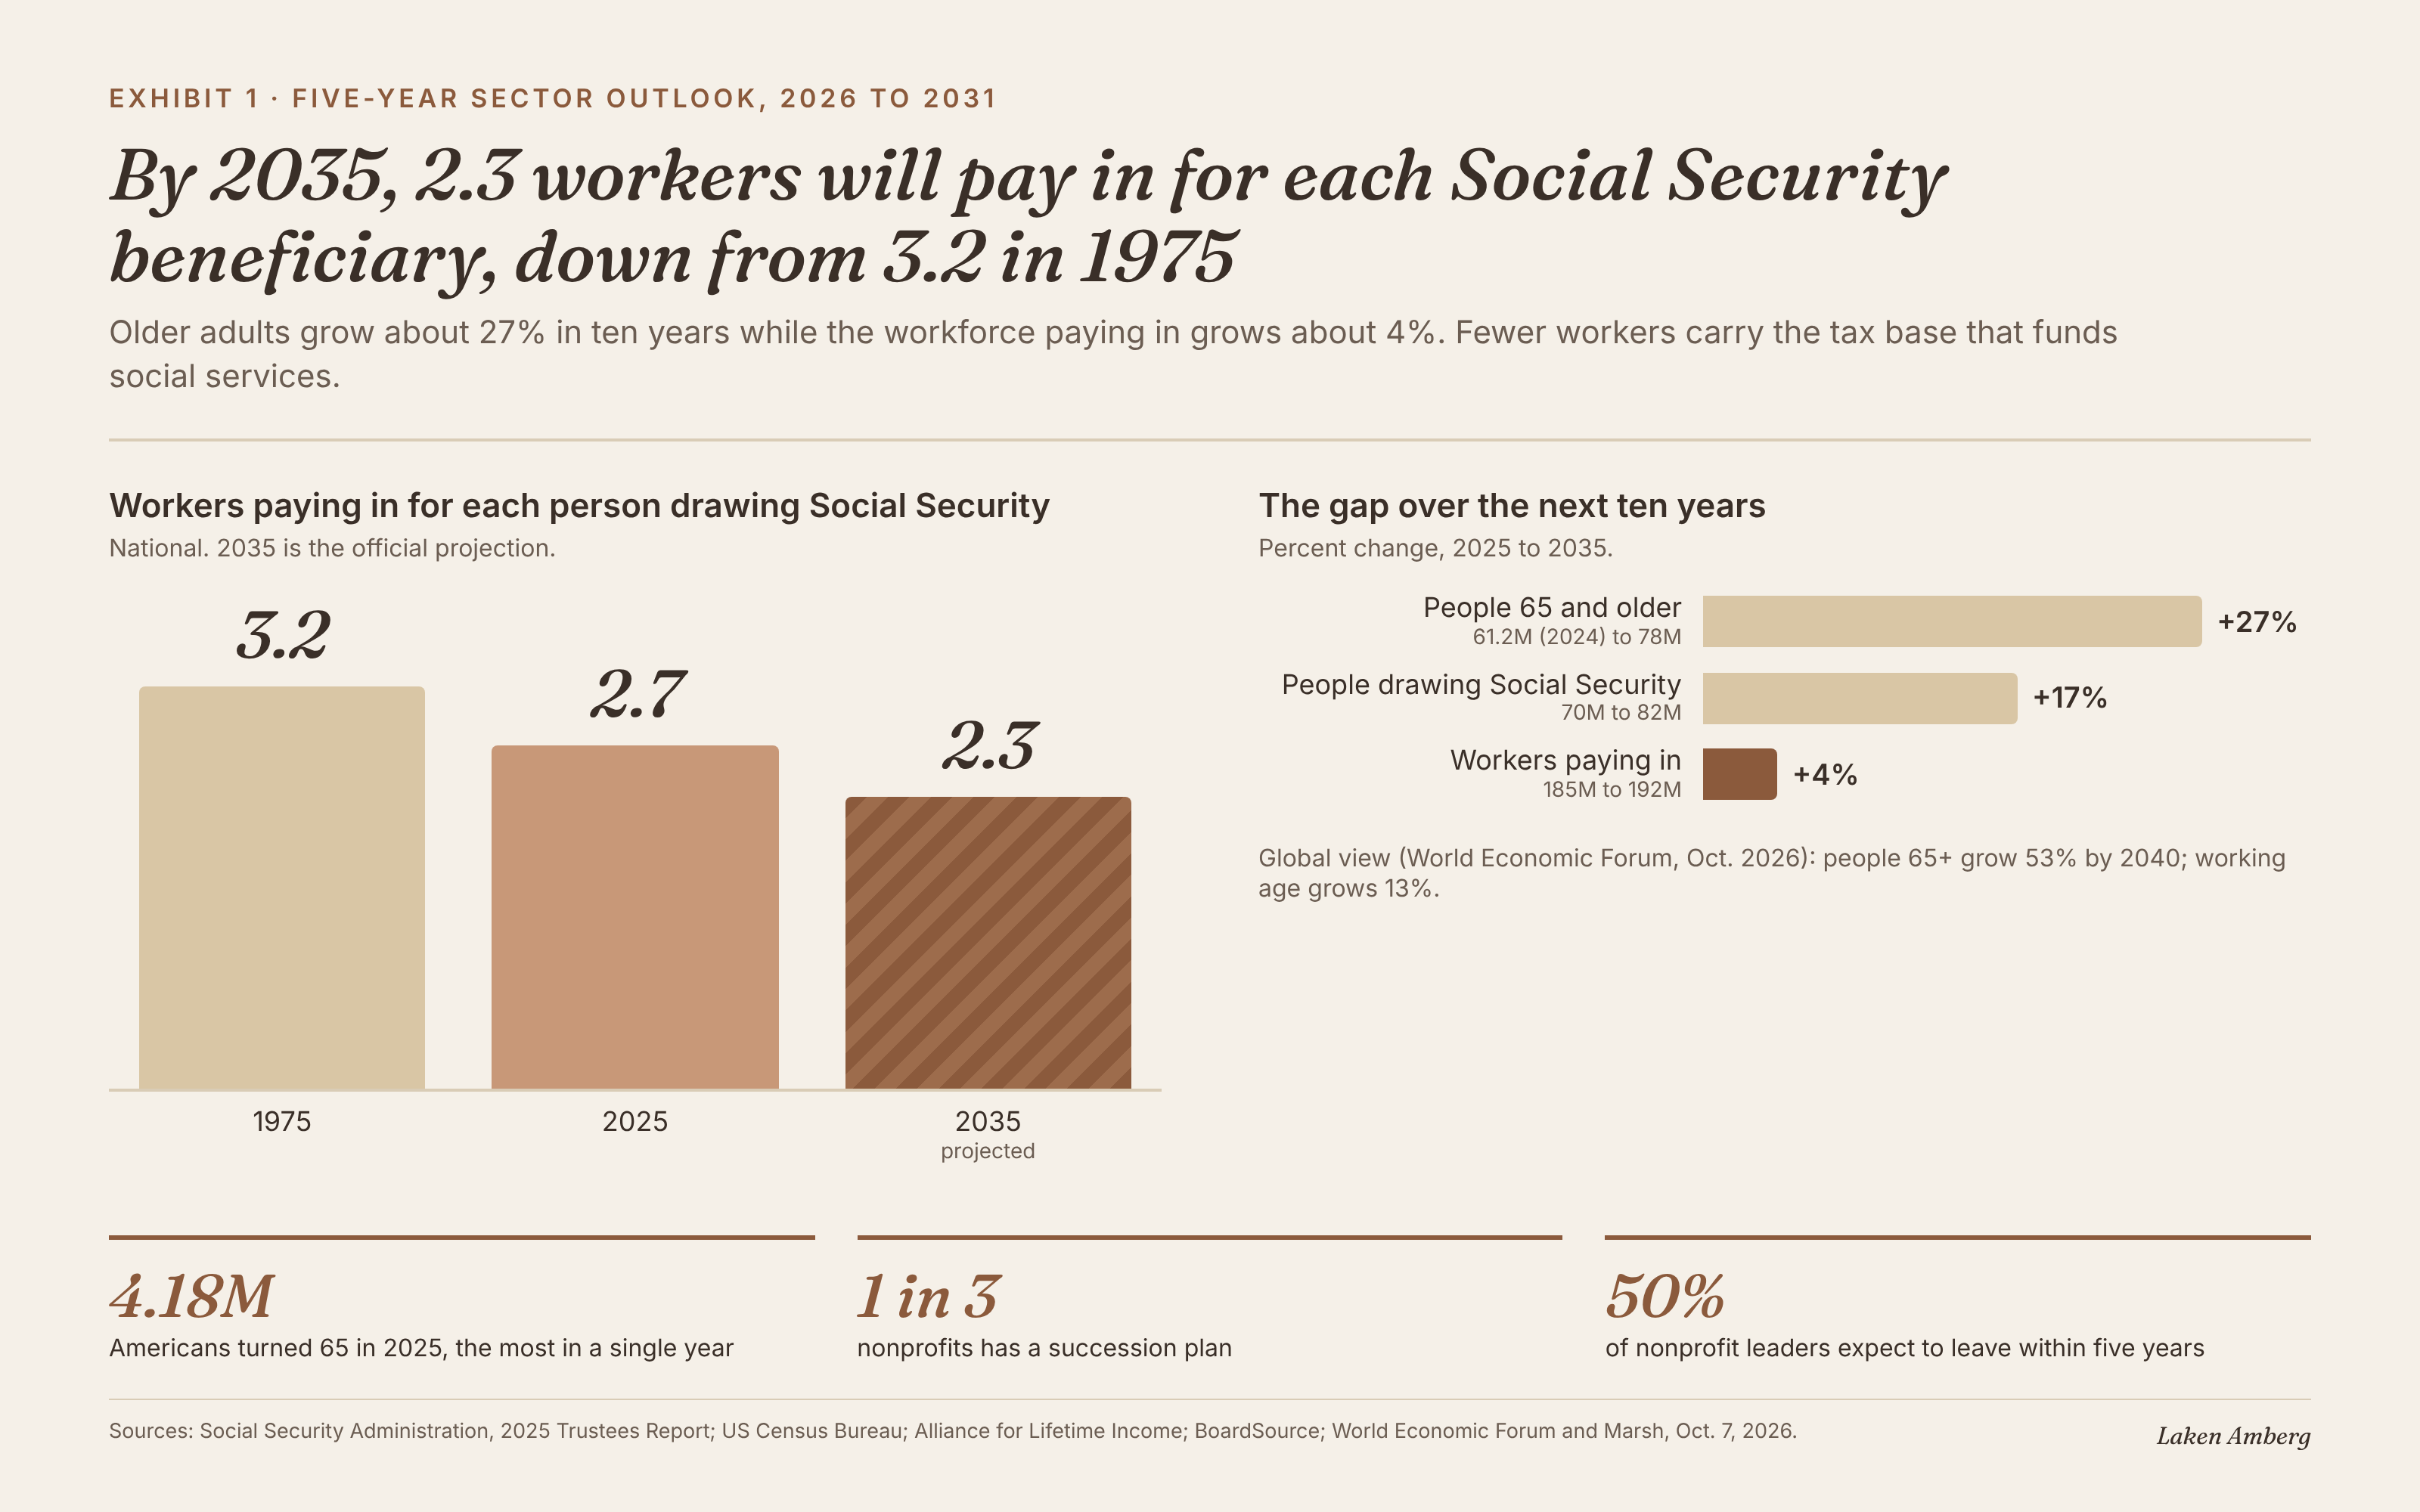
Five-Year Sector Outlook: fewer workers per retiree
Older adults grow about 27% by 2035 while the workers paying in grow about 4%. Half of nonprofit leaders expect to leave within five years, and one in three organizations has a succession plan.
Click the image to enlarge